WARNING! Gitlab maintenance operation scheduled for Monday, 20 April between 12:00 and 14:00 (CET). During this time window, short service interruptions (less than 5 minutes) may occur. Thank you in advance for your understanding.
[CI] Add history graph to report page
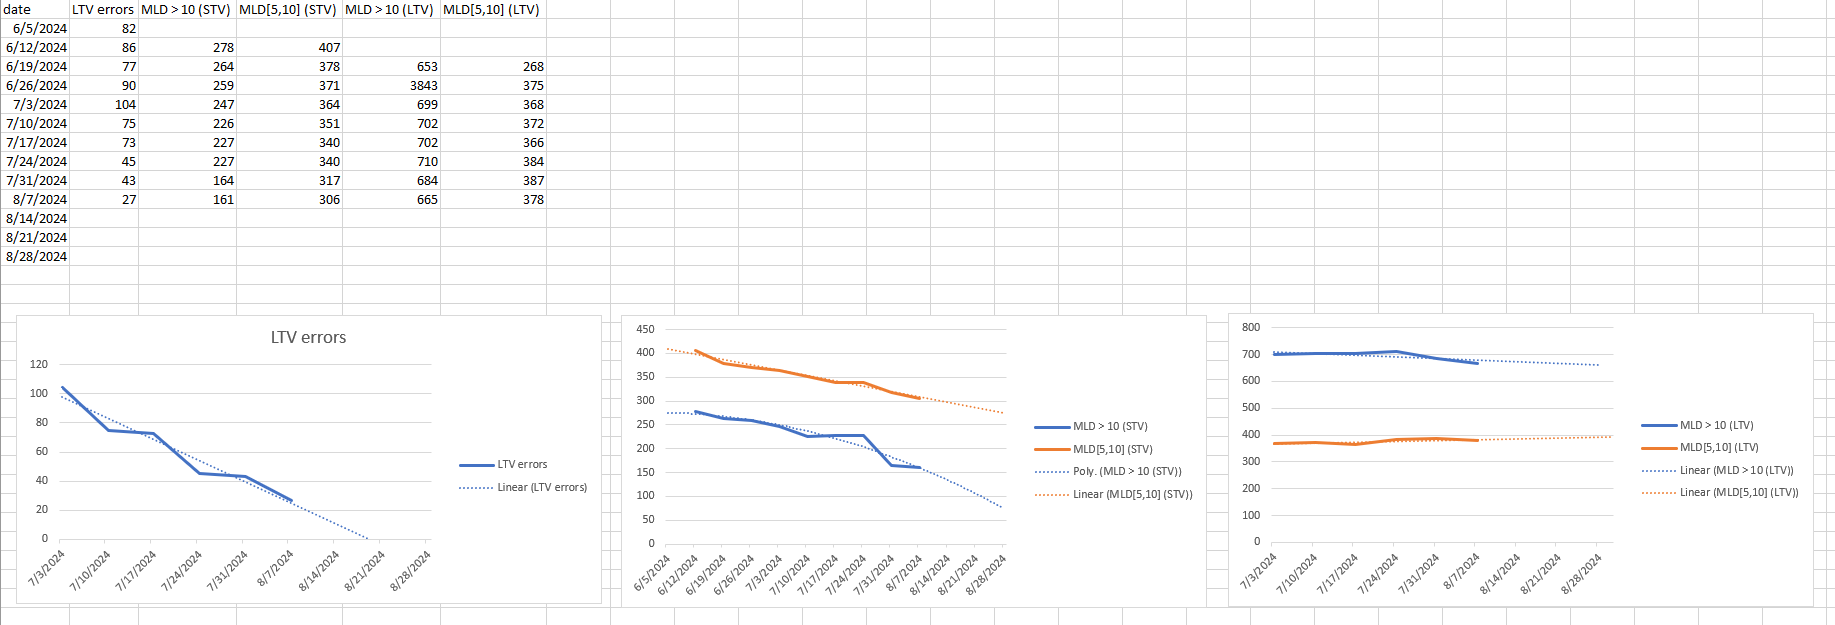
The progression over time of the MLD values prepared by @jtorr gave a nice overview of the status:
It would be nice to have such graphs automatically generated and published on the report page.